Mapping North London Housing
By Jim Jepps
There’s a very interesting new website called Datashine that creates maps based on census data. I thought I’d check out some of the breakdowns for housing in North London (click images to enlarge). I heartily recommend having a play with the site yourselves, there’s all sorts of metrics you can investigate – religion, gender, education, health, the works.
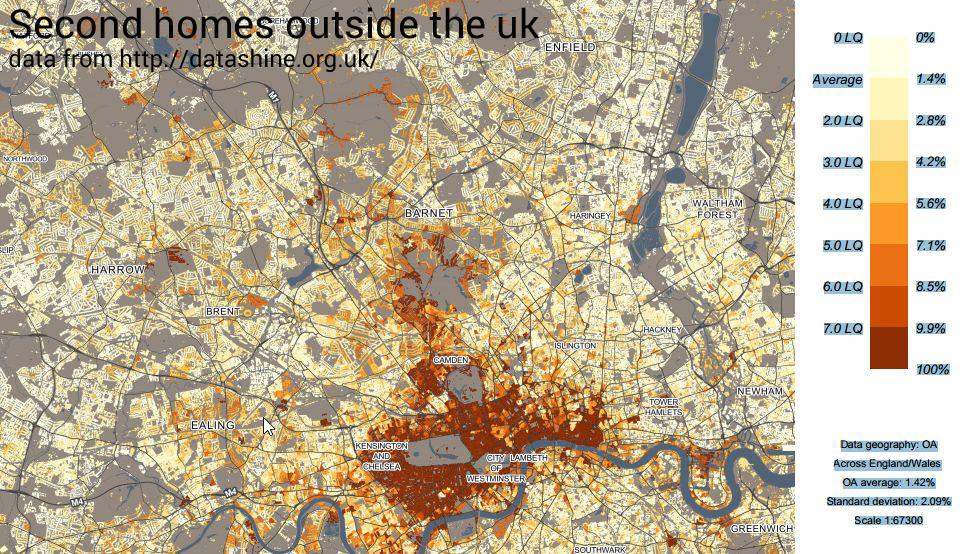
This first one is not exactly a map of Russian oligarchs… but it isn’t far off. The darker areas show where those with second homes outside the UK live (which would include both oligarchs and Guardianistas with holiday homes in Burgundy).
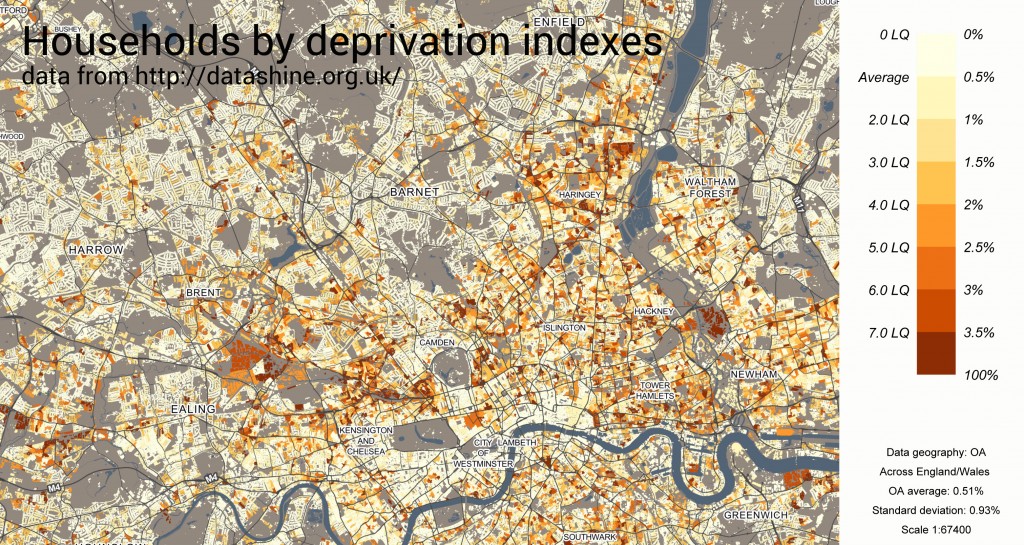
This map shows more clearly where those households who have more than one ‘deprivation index’ lives. Not an exact science of poverty, but pretty close. The darker the shading, the more deprived the area.
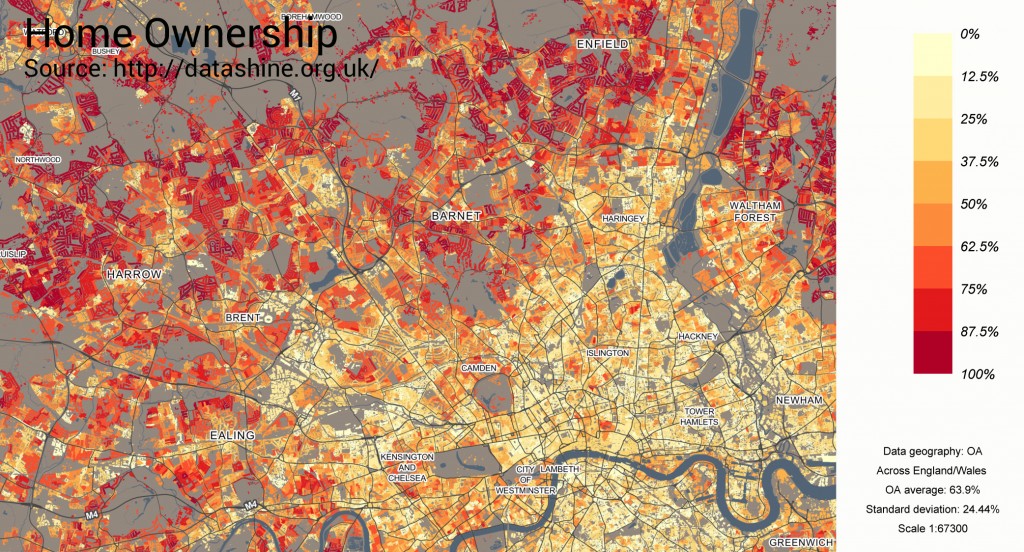
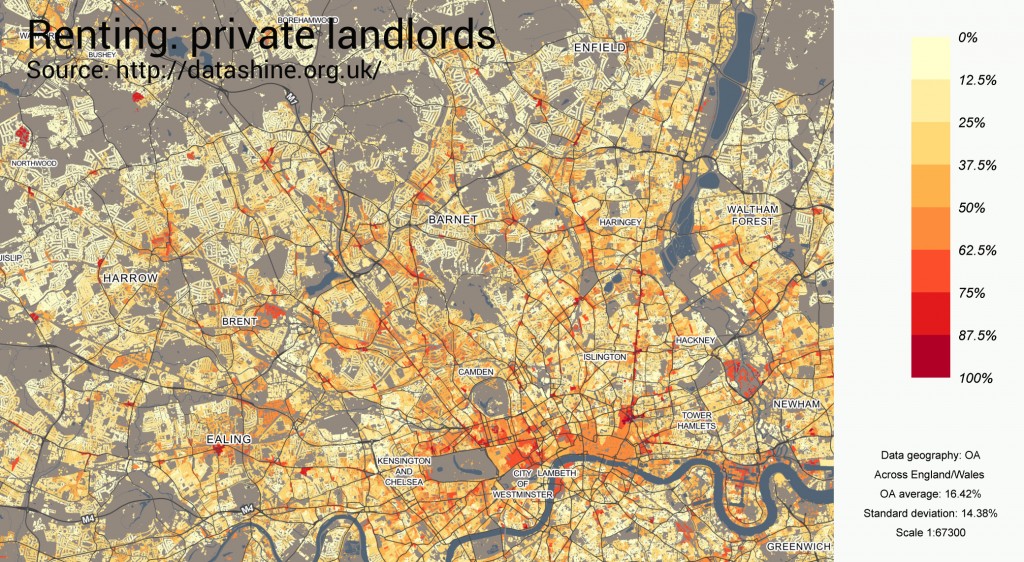
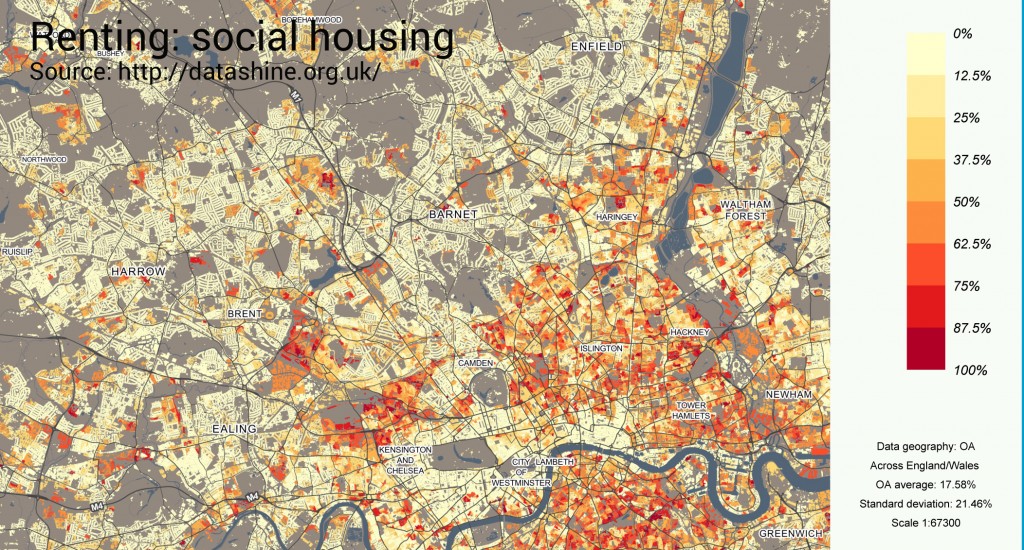
Let’s move directly on to home ownership and renting, both social and private. The darker the area the greater the level of home owners, or renters depending on the map.
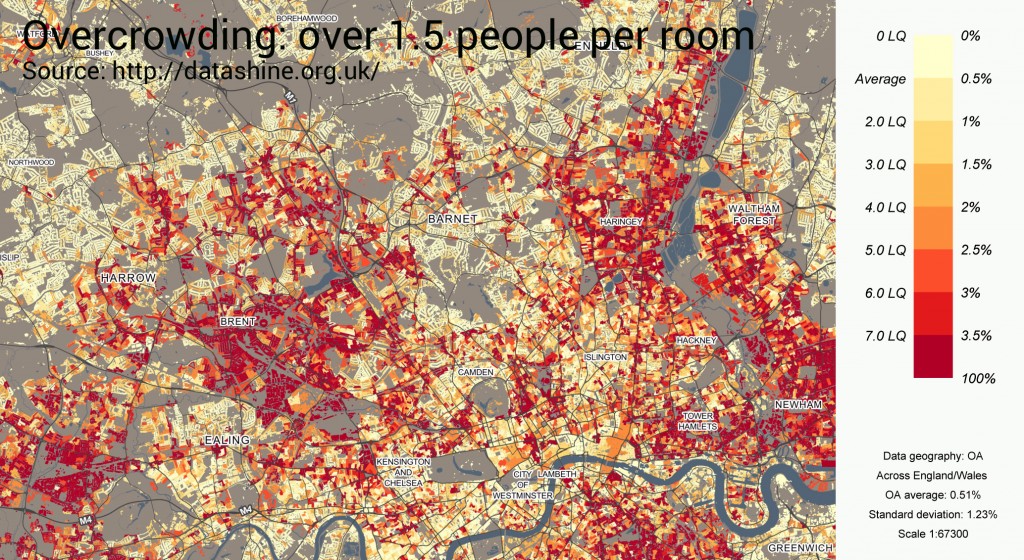
One map with a very clear pattern is when we look at households with more than 1.5 people per room. Let’s look at the most over crowded areas in North London (again, you can click the map to enlarge it).


Join the discussion